
| Line item | Month 1 | Month 2 | Month 3 | Month 4 | Month 5 | Month 6 | Month 7 | Month 8 | Month 9 | Month 10 | Month 11 | Month 12 |
|---|---|---|---|---|---|---|---|---|---|---|---|---|
| Selected-method volume / demand | 1,035 | 1,105.65 | 1,177.63 | 1,250.99 | 1,325.79 | 1,402.09 | 1,479.95 | 1,559.42 | 1,640.58 | 1,723.49 | 1,808.21 | 1,894.82 |
| Selected-method price / value | $125.00 | $125.61 | $126.22 | $126.83 | $127.45 | $128.07 | $128.70 | $129.32 | $129.95 | $130.58 | $131.22 | $131.86 |
| Seasonality factor | 1.00x | 1.06x | 1.10x | 1.12x | 1.10x | 1.06x | 1.00x | 0.94x | 0.90x | 0.88x | 0.90x | 0.94x |
| Opening customers | 1,000 | 1,070 | 1,141.3 | 1,213.96 | 1,288.02 | 1,363.56 | 1,440.62 | 1,519.27 | 1,599.58 | 1,681.59 | 1,765.39 | 1,851.04 |
| New customers | 90 | 92.7 | 95.48 | 98.35 | 101.3 | 104.33 | 107.46 | 110.69 | 114.01 | 117.43 | 120.95 | 124.58 |
| Churned customers | 20 | 21.4 | 22.83 | 24.28 | 25.76 | 27.27 | 28.81 | 30.39 | 31.99 | 33.63 | 35.31 | 37.02 |
| Closing customers | 1,070 | 1,141.3 | 1,213.96 | 1,288.02 | 1,363.56 | 1,440.62 | 1,519.27 | 1,599.58 | 1,681.59 | 1,765.39 | 1,851.04 | 1,938.6 |
| Revenue | $129,375.00 | $147,211.71 | $164,087.08 | $177,708.30 | $186,534.22 | $190,342.34 | $190,462.26 | $189,567.50 | $191,040.10 | $198,053.01 | $212,614.69 | $234,856.17 |
| Contribution profit | $100,912.50 | $114,825.14 | $127,987.93 | $138,612.47 | $145,496.69 | $148,467.03 | $148,560.56 | $147,862.65 | $149,011.28 | $154,481.35 | $165,839.46 | $183,187.81 |
| Annualized run-rate | $1,605,000.00 | $1,720,283.00 | $1,838,702.61 | $1,960,382.34 | $2,085,449.84 | $2,214,037.02 | $2,346,280.21 | $2,482,320.30 | $2,622,302.94 | $2,766,378.65 | $2,914,703.07 | $3,067,437.08 |
| Actual revenue | — | — | — | — | — | — | — | — | — | — | — | — |
| Actual vs forecast variance | — | — | — | — | — | — | — | — | — | — | — | — |
| Variance % | — | — | — | — | — | — | — | — | — | — | — | — |
| Customer check | 0 | 0 | 0 | 0 | 0 | 0 | 0 | 0 | 0 | 0 | 0 | 0 |
How does the revenue forecast work?
Customers × ARPU | Units × price | Capacity × utilization × price | Pipeline × win rate × deal value | Market size × shareSelect the structure that matches the decision and available evidence. Each method separates demand or volume from price, applies the chosen scenario and a visible monthly seasonality factor, then calculates variable cost and contribution profit. Optional comma-separated actual revenue populates monthly actual-versus-forecast variance without replacing the forecast formulas.
Worked base case
The default customers-by-ARPU case begins with 1,000 customers, adds 90, loses 20 to churn and closes Month 1 with 1,070. Twelve-month revenue totals $2,211,852.37 and the Month 12 annualized run-rate is $3,067,437.08.
How should the drivers be designed?
Customers × ARPU fits subscriptions; units × price fits product volume; capacity × utilization fits constrained services or locations; pipeline fits sales-led businesses; and market size × share is a top-down reasonableness case. Base, Downside and Upside apply explicit demand, price and churn factors. Seasonality changes timing without changing the underlying method, while actuals expose variance as periods close.
What does the model check?
- Customer roll-forward logic reconciles whenever the customer method is selected.
- Revenue equals the selected method’s volume or demand driver times price and seasonality.
- Actual-versus-forecast variance is calculated only where actual figures are entered.
- Variable costs, utilization, win rate, market share and customer counts remain within bounded ranges.
Limitations and failure states
This educational forecast provides reusable archetypes rather than industry-specific revenue recognition. It does not model cohort-level retention, contract liabilities, bookings-to-revenue conversion, sales-rep capacity by cohort, multiple products, foreign exchange or accounting policy. Use the top-down method as a cross-check, not a substitute for observable bottom-up drivers.
Actual workbook preview
See exactly what you will receive
These are direct renders of the delivered revenue forecast model workbook—not a reconstructed mockup. Open any image to inspect the full-size sheet before requesting the file.
Change assumptions and scenarios without editing calculation cells.
Trace values pulled from assumptions and connected schedules.
Dedicated checks identify whether the workbook reconciles and where to investigate.
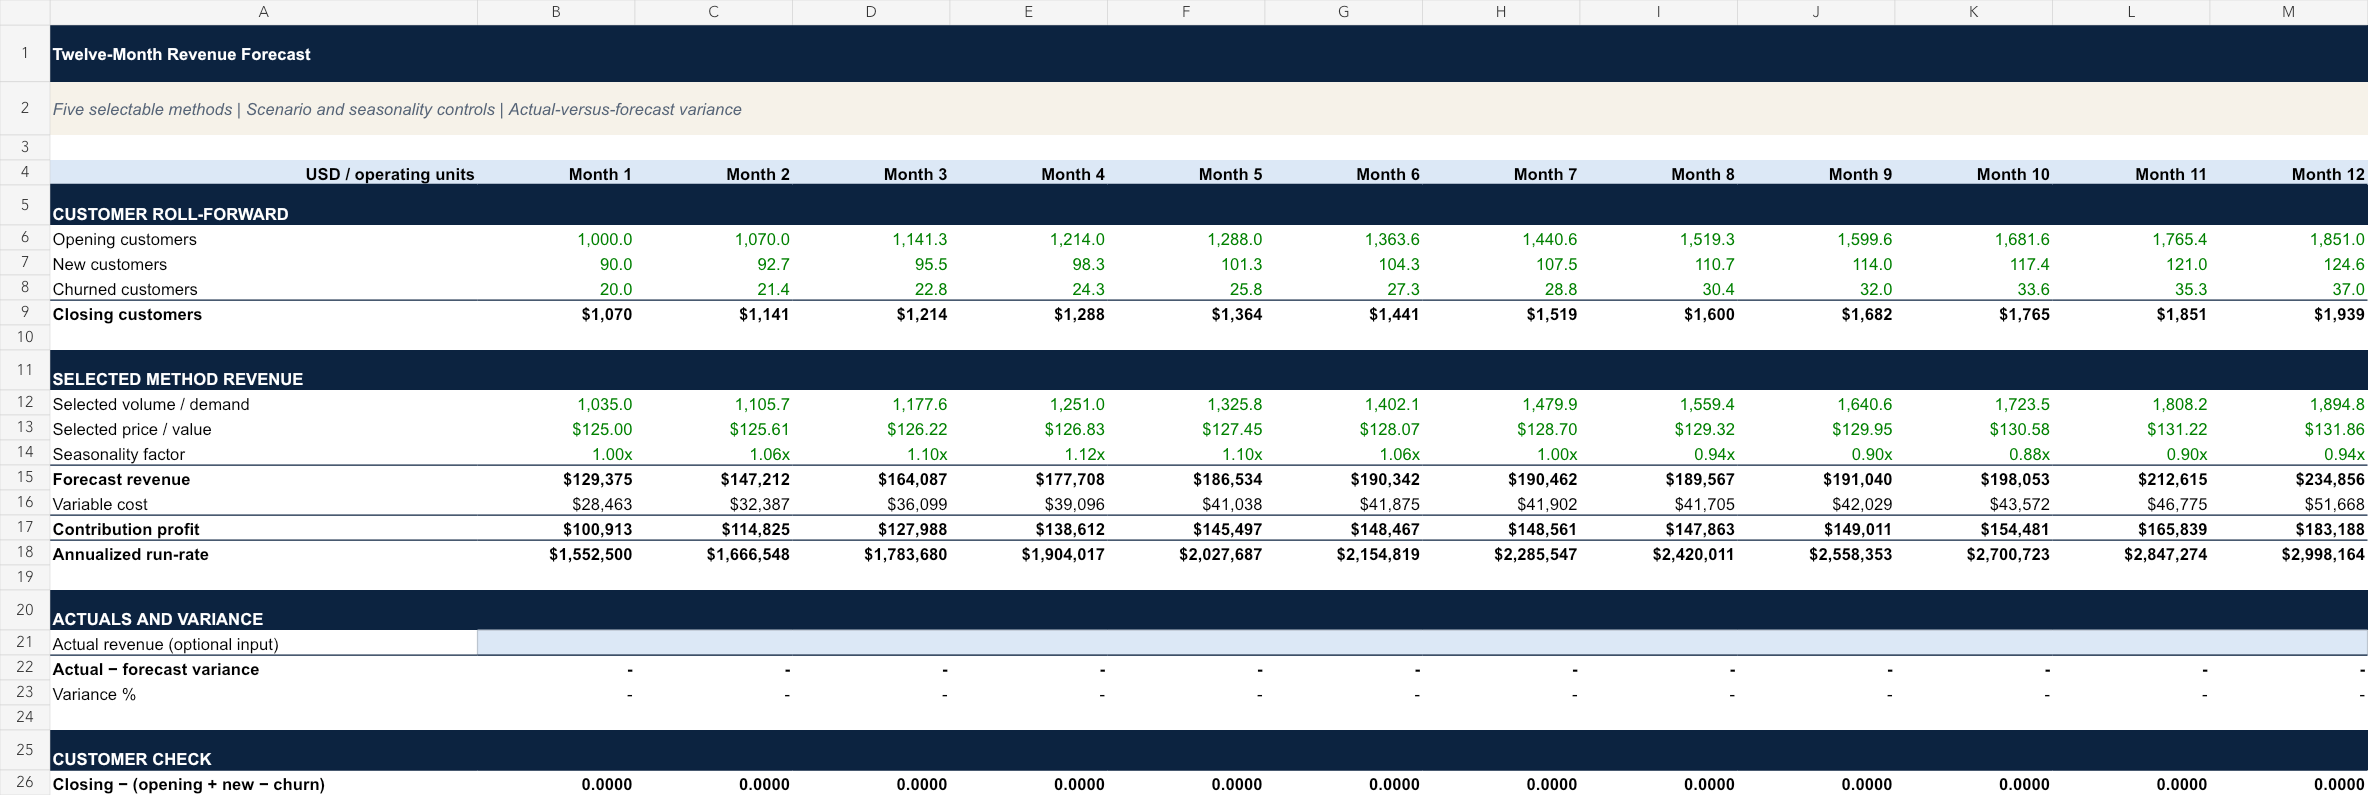
Look for: the customer roll-forward, price build, monthly revenue, contribution profit and ARR run-rate across all twelve months.
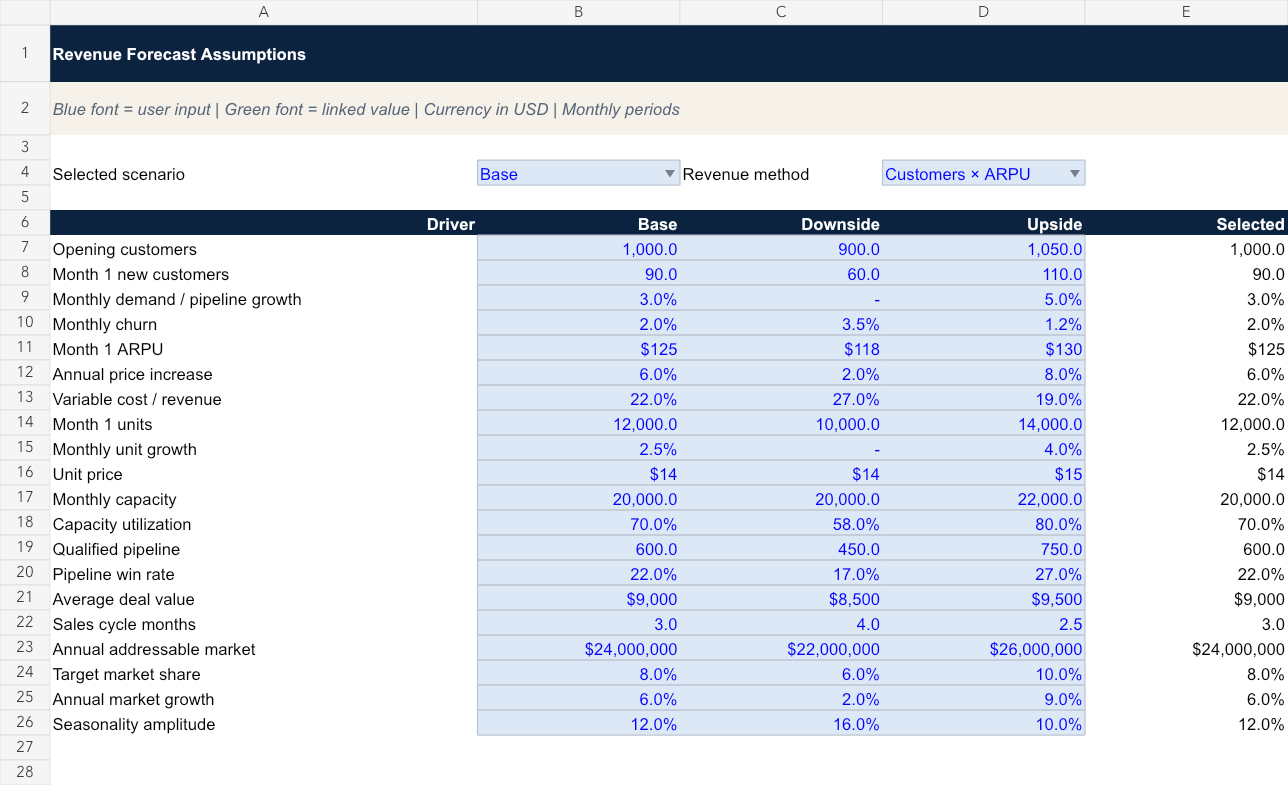
Look for: blue Base, Downside and Upside inputs for new customers, churn, ARPU, price increases and variable cost.
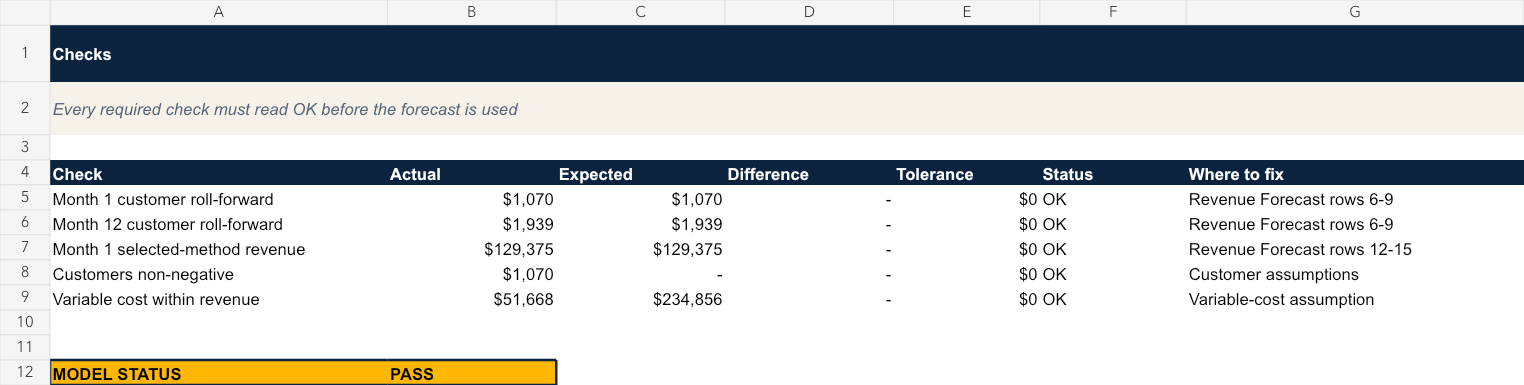
Look for: zero customer differences, recomputed revenue and a PASS model status.
Included in the file
- Twelve-month customer cohort roll-forward
- New-customer, churn, ARPU and pricing drivers
- Revenue, variable cost, contribution profit and ARR
- Base, downside and upside assumptions
- Dedicated checks, instructions and source URLs
Free editable Excel workbook
Get the revenue forecast model
The workbook is free and contains the exact model shown above: editable assumptions, linked formulas, checks and source notes.
The browser calculator above is free with no sign-up. Email is used only to deliver the workbook; marketing permission is separate and optional.
Sources, version and review status
Revenue presentation is grounded in the statement context from Beginners’ Guide to Financial Statements; model-input and scenario conventions follow the site’s calculation methodology. Version 1.0 was last checked on 2026-08-26. All figures are illustrative; no named external expert reviewer is claimed.
Related models and formulas
Frequently asked questions
What is revenue forecast model?
A revenue forecast model converts operational drivers such as opening customers, new customers, churn, price and variable cost into monthly revenue and run-rate outputs.
How should I use revenue forecast model?
Use the formula only after matching every input to the same period, unit and definition. Then compare the result with a worked example and the decision you are trying to make.
What is the most common mistake with revenue forecast model?
The most common mistake is applying a growth rate directly to revenue without reconciling the customer or volume and price drivers underneath it.
Can I calculate revenue forecast model in a spreadsheet?
Yes. Reproduce the displayed equation with separate cells for each input, keep percentages as decimals, and test the spreadsheet against the worked example before replacing the sample figures.